The essential returns KPIs every retailer should track

Contents
Gain better insights on your returns journey with our returns solution.
How retailers manage their returns journeys has become a hot topic lately, and it is for a good reason. The way you manage returns impacts not only your costs but also your brand reputation, customer satisfaction, and long-term loyalty. In recent years, retailers have started to reevaluate how they think about returns rather than just accepting that it is a necessary evil that they have to deal with.
To get a good baseline on how your returns experience is doing, it’s important to measure the right returns KPIs. This way, you can use this as a way to benchmark and optimize your returns experience. Here’s a breakdown of the most important return KPI categories and why they matter.
Speed & transparency
Why it matters: Speed and clarity are critical in shaping customer trust. Returns are inherently disappointing for the customer and the retailer, but quick, transparent processes can transform frustration into reassurance.
Here are the KPI’s you should be measuring around speed and transparency within the returns journey:
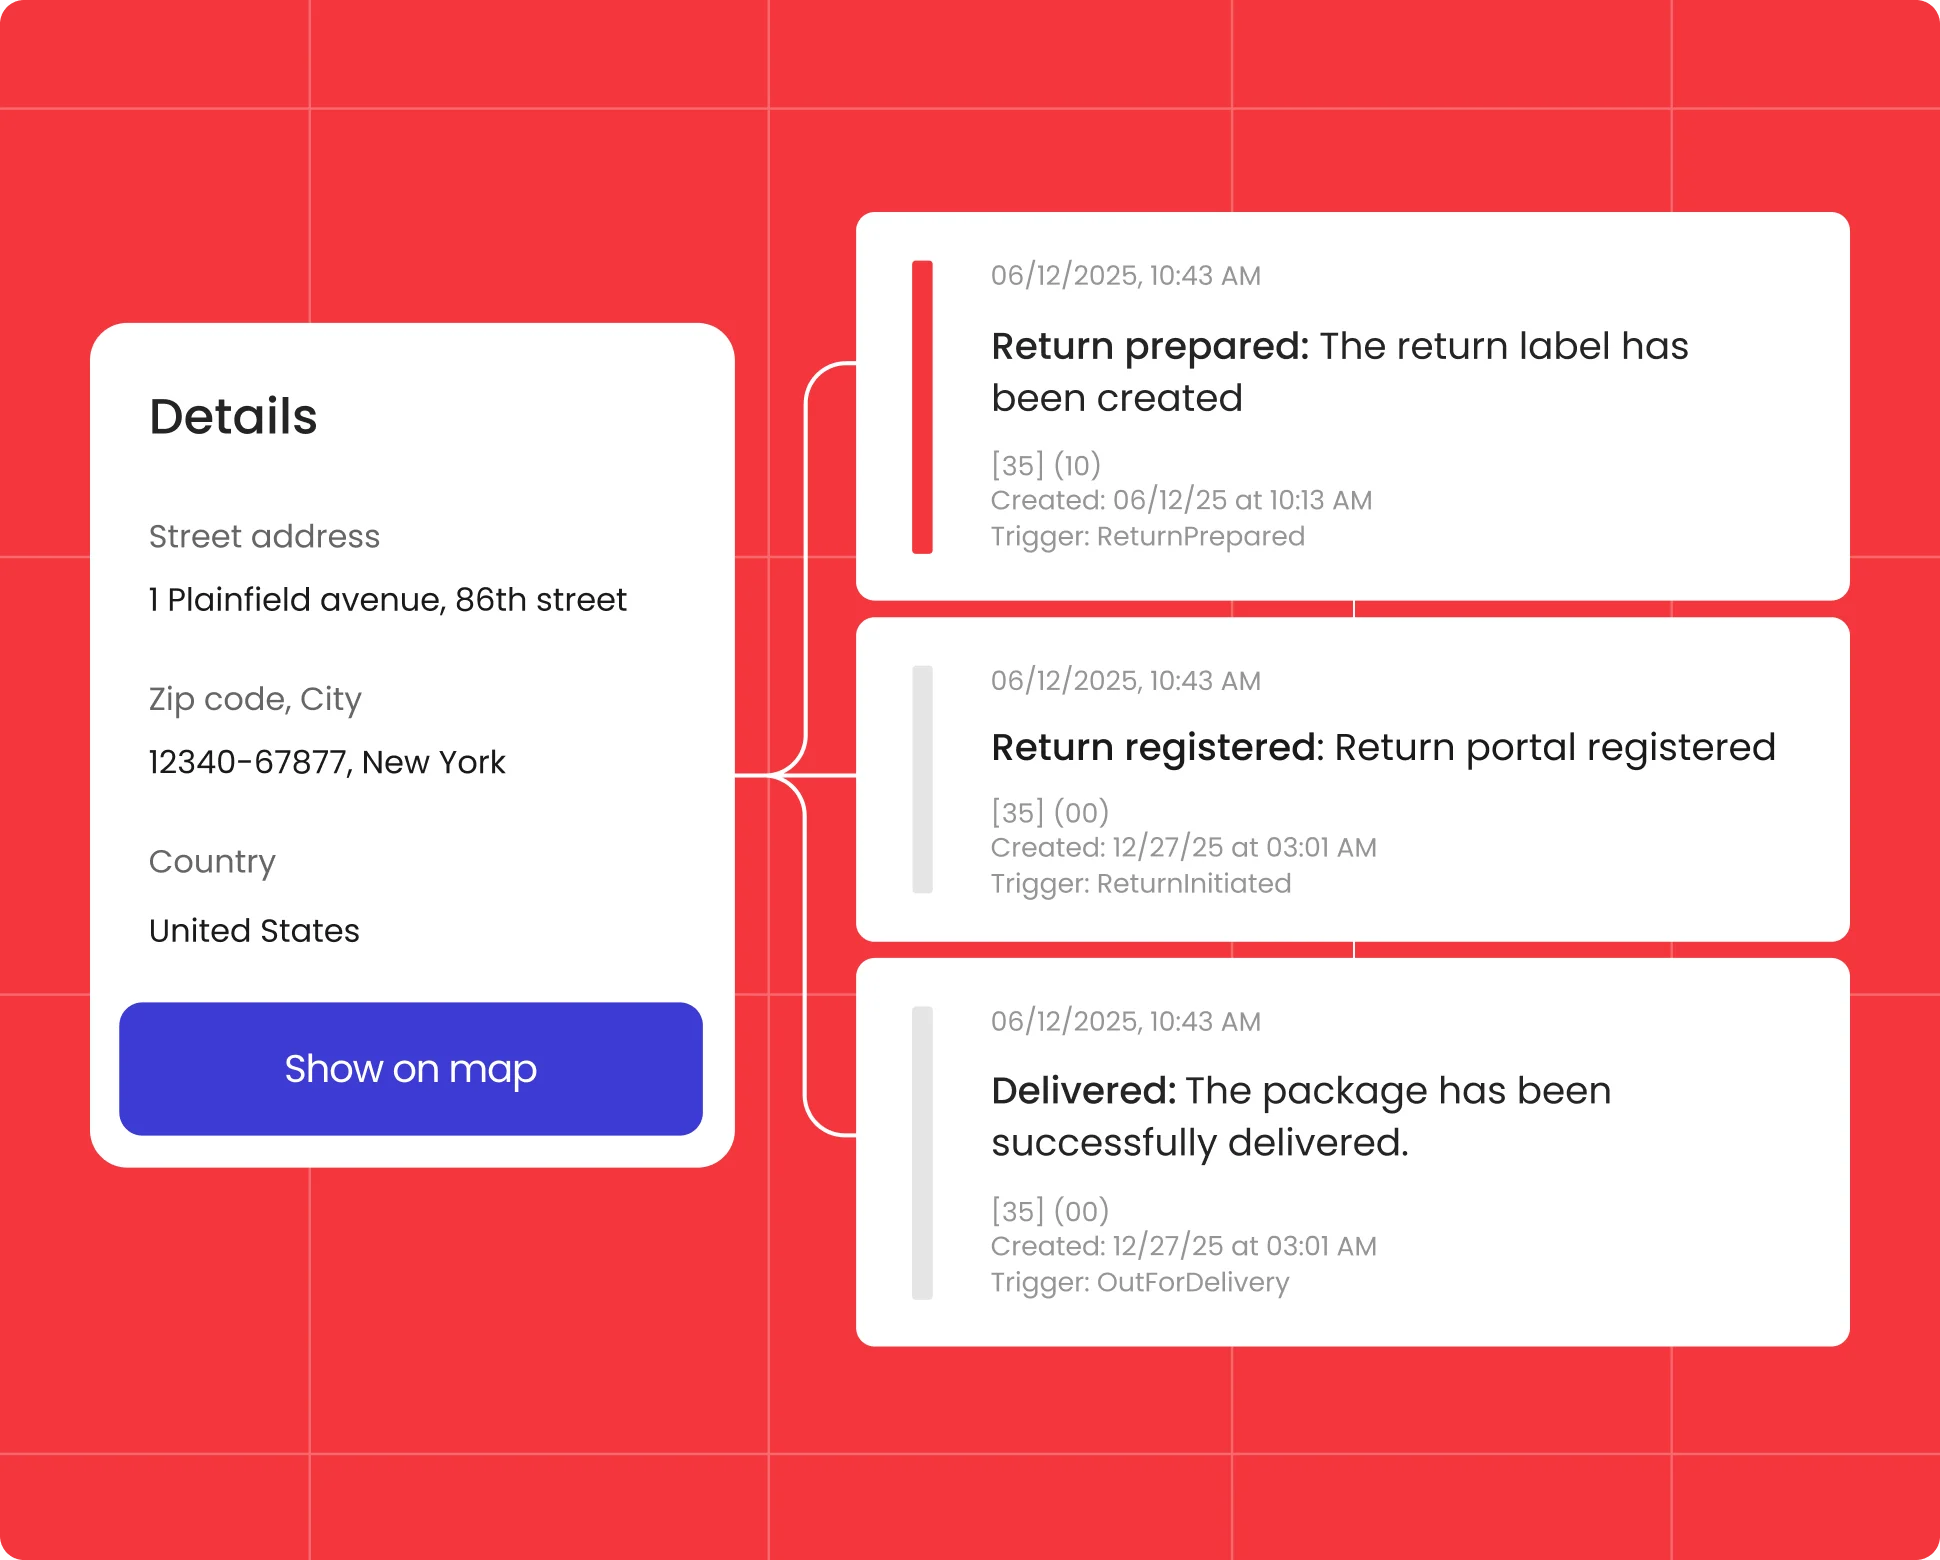
- First message response time: Measures how long it takes to confirm a return after the customer initiates it. For example, how long does it take for your customer to receive a return confirmation message? A fast response signals professionalism and helps reduce inquiries.
- Time to resolution: Tracks the total duration it takes to fully resolve a customer’s return request. This is a direct reflection of an efficient, easy process and customer trust.
- Refund time: Measures the window between product arrival at the warehouse and refund payout. It’s one of the biggest drivers of customer satisfaction.
- First call resolution: If customers contact your customer service team to make a return, this should be used to measure the percentage of return issues resolved during their first call/chat with your team. This shows how effective your agents are and improves customer satisfaction.
- Average handling time: Tracks the average time spent on your customers’ return inquiries from start to finish once initiated through your customer service team.
- Cost per contact: Measures the average cost of a single customer inquiry related to returns. This can be calculated by dividing the total expenses of your returns process by the number of contacts handled.
Customer experience & satisfaction
Why it matters: Returns are a loyalty-building moment. How customers feel during the process can determine whether they return to your brand or shop elsewhere.
- Customer Effort Score (CES): Evaluates how easy the return process feels to the customer. Low effort = higher likelihood of repurchase. This means looking at your customer returns journey. Are the only ways to return an item through customer service or in-store? Do you have a self-service return portal? Do you offer exchanges? Do customers have to print labels, or can they use QR codes?
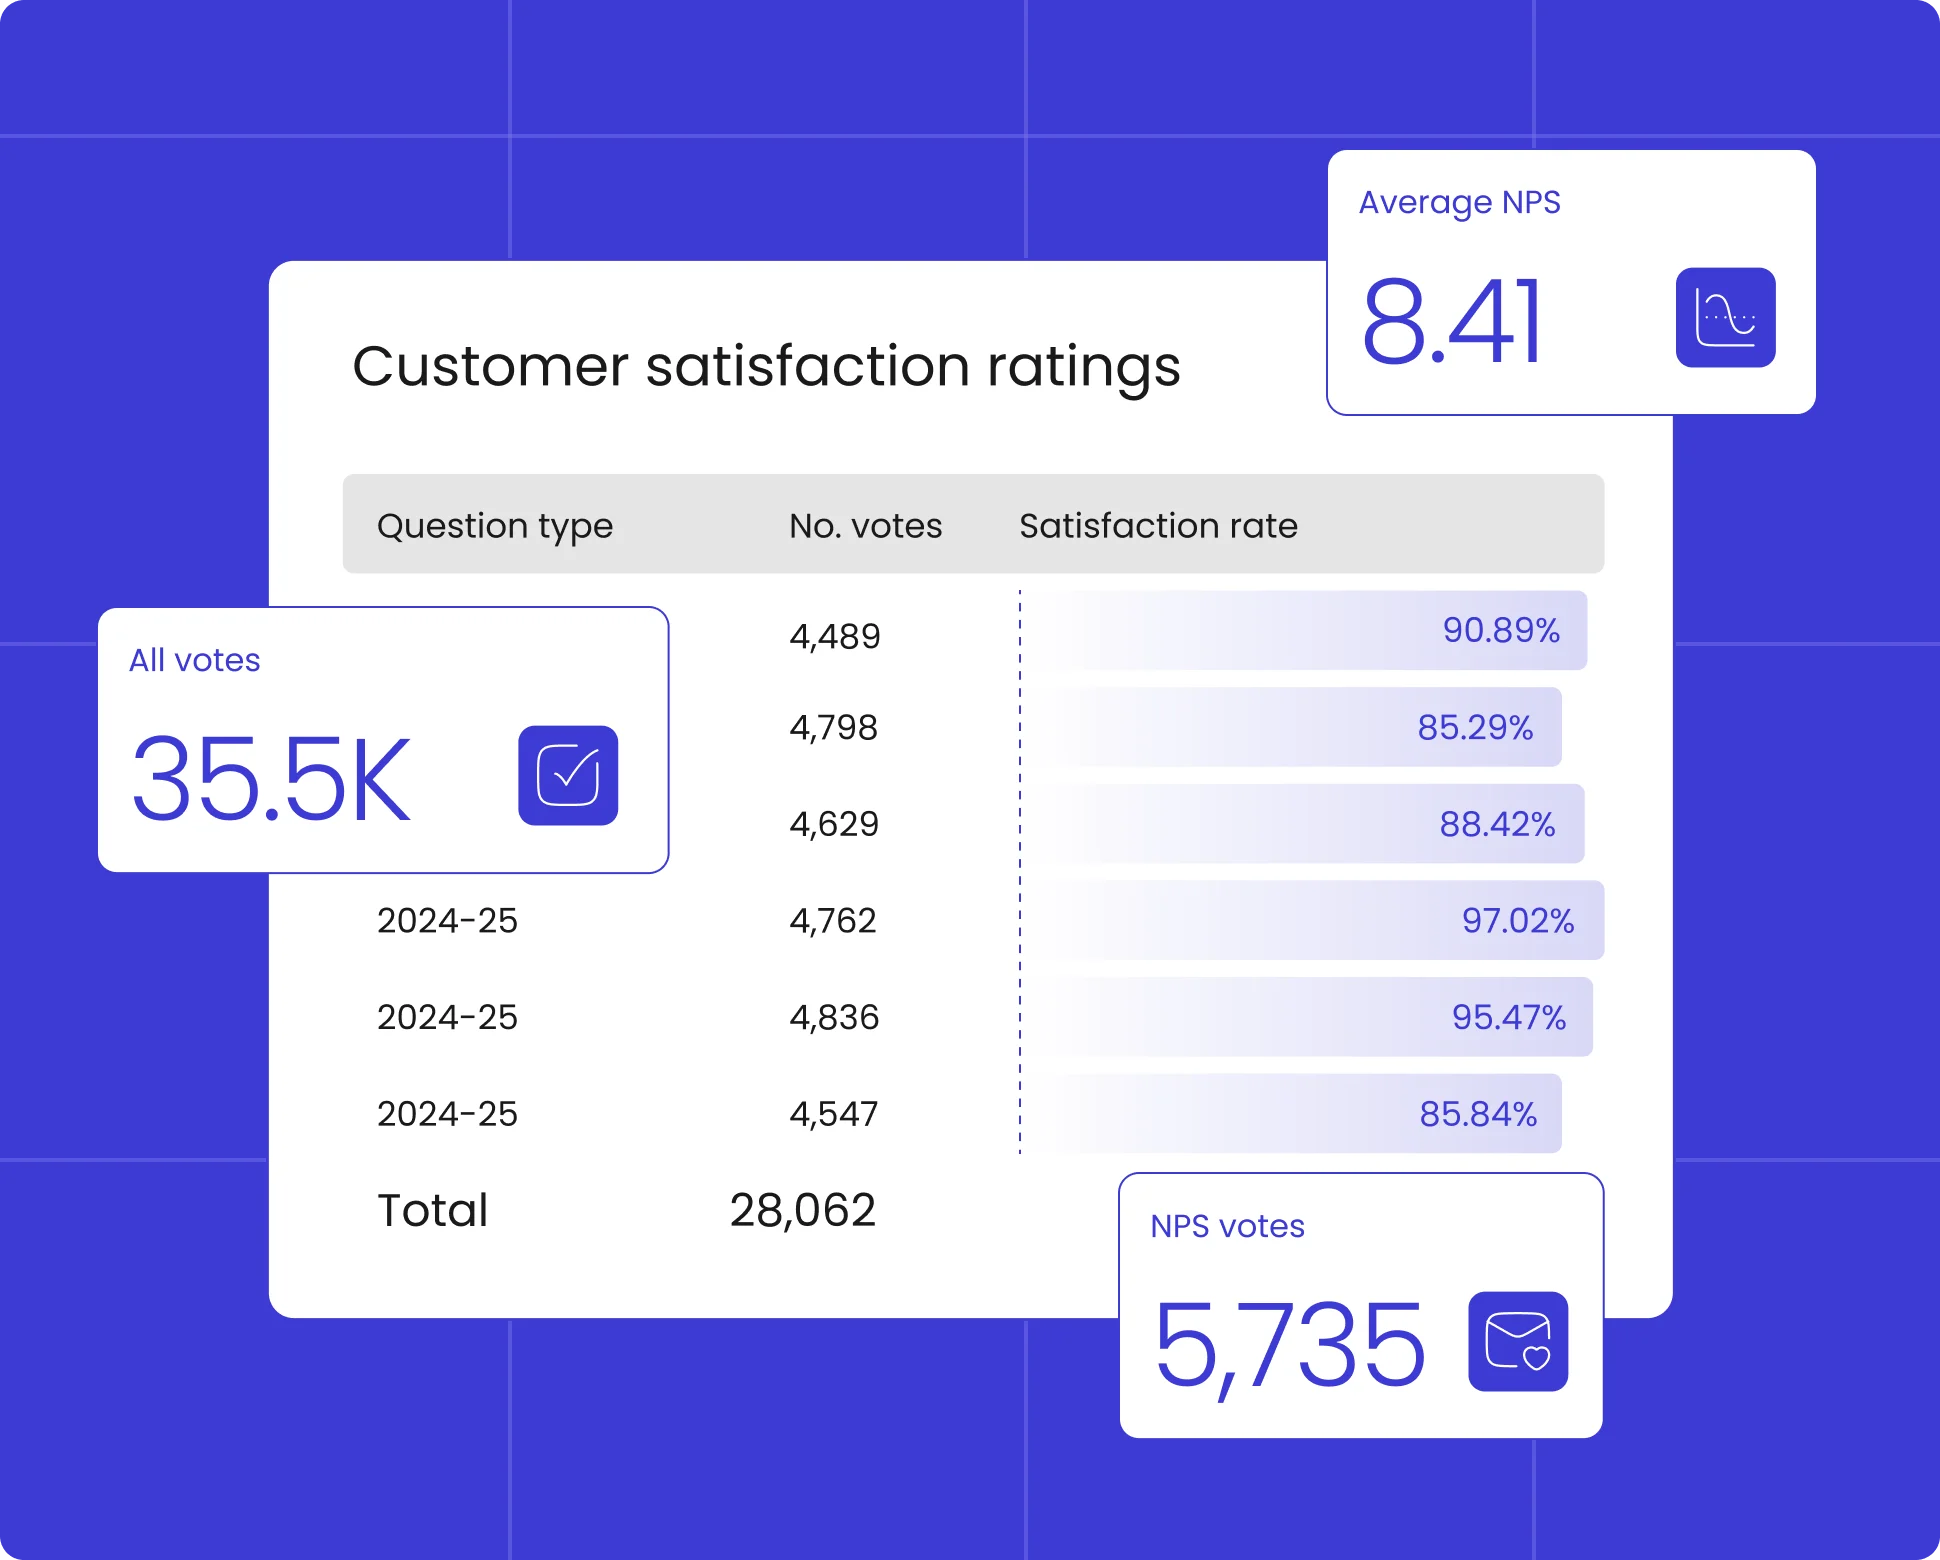
- Net Promoter Score (NPS): Measures customer loyalty and how likely your customer would recommend your brand to others. This is a more general score compared to a CSAT.
- Customer Satisfaction Score (CSAT): Measures short-term customer satisfaction about a specific area. In relation to returns, you would ask customers questions about their return experience. Customers should be surveyed about this within their return communication emails for a better response rate.
Identifying root causes & return reasons
Why it matters: Returns data provides a goldmine of insights. Understanding why products come back helps retailers prevent future returns and improve what they offer.

- Return rate by category/segment: Tracks the percentage of products returned and who is returning them. High return rates can flag issues with product quality, sizing, or materials.
- Return reasons: Captures why shoppers are returning their items. This could be in relation to fit, defects, or wrong expectations. Insights feed back into product development.
- Article return rate: Measures the percentage of products that customers return. It is calculated by dividing the number of returned items by the total number of items sold, then multiplying it by 100.
- Average return time to warehouse: Indicates the amount of time for a returned item to be received and processed by a company’s warehouse. This reveals how efficient your returns process is.
Efficiency & cost effectiveness
Why it matters: Returns impact the bottom line. When you optimize for efficiency and experience, it reduces costs while keeping customers happy.
- Cost per return: Calculates the total cost to the business per return. This KPI can make hidden costs visible so brands can make decisions about whether they should charge for returns, how much products should cost, etc.
- Support tickets per 1,000 returns: Indicates how many return-related inquiries are generated. High numbers may suggest unclear return processes.
- Total returns registered: Measures the amount of customer returns within a specific time period. This can shift before, during, and after peak season. This is good to compare between different seasons, different years, and when you make changes to your products or returns processes.
- Exchange ratio: Indicates how many customers made an exchange rather than returning the item for a refund. It can be a great indicator of an efficient process plus you retain revenue that otherwise would have been lost.
Sustainability & value retention
Why it matters: Returns aren’t just financial. They have environmental and reputational impacts too. Sustainable, value-driven strategies improve margins and Environmental, Social, and Governance (ESG) performance.
- Resale rate: Tracks the amount of returned items that can be resold. A high resale rate is good for margin, inventory turnover, and your carbon footprint.
- Write-off losses: Measures the value lost due to damages, lost or stolen items, unsellable items, or seasonality. This can be a significant cost driver. It is good to know how many losses you have, so you can try to figure out ways to combat this in the future. Although some things may be unavoidable, there are certain measures your brand can put in place to decrease this number.
Final Thoughts
Tracking returns KPIs is about more than operational efficiency. It’s about redefining returns as an opportunity to win customer trust, strengthen loyalty, reduce costs, and operate more sustainably. Retailers who treat returns as a strategic growth lever, not just a necessary cost, will be the ones who stand out in an increasingly competitive market.
By focusing on these returns KPIs, you’re not just managing returns. You’re understanding how to improve your experience and turn returns into a retention engine.
Liked this Post? View more related posts below